Friday, August 21, 2009
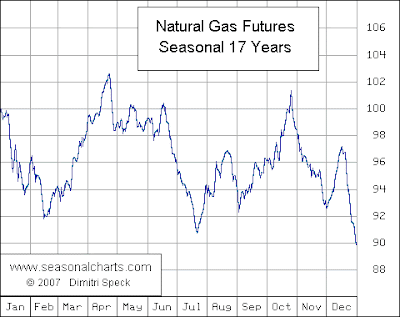
Natural Gas Commodity Prices Drop to a 7-Year Low!
The price drop was exasperated by the rise in supply as the EIA reports a rise of 55 billion cubic feet to stand at 3204 Bcf, which is 562 Bcf higher than last year at this time and 513 above the 5-year average. Barring any storms, the glut of supply will continue to hurt prices. – data source MarketWatch
The economic recession is also tampering demand, but new clean energy politics is on the table. T. Boone Pickens has been lobbying congress to use natural gas as the clean-energy solution for vehicles to rid our dependence on oil. “He touted natural gas as the best alternative vehicular fuel because it’s a domestic resource that reduces our foreign oil consumption, and enhances America’s energy security; clean (NGV vehicles emit up to 95 percent less pollution than gasoline or diesel vehicles); less expensive than petroleum and hydrogen; and safe (lighter-than-air compressed natural gas is nontoxic and disperses quickly, and has a higher ignition temperature than gasoline and diesel fuel, which reduces the chances of accidental ignition).”
–www. Boonespickens.com
There isn't a pure trading vehicle for the Natural Gas Commodity, these ETFs are the closest thing available:
Natural Gas Industry: $FCG
Natural Gas Commodities futures: $UNG
Oil and Natural Gas exploration and production: $XOP
Oil and Natural Gas equipment and services: $PXJ
@stockaddict
Sunday, August 16, 2009
The Power of Technical Analysis; A Case in Point Study of the S&P500 Chart.
Case in point is the SPY500 starting back in 2004 in mid-bubble times. Note that there are other Technical factors contributing to the success of the patterns, such as the 50MA crossing above the 200MA in mid 2004, then below it towards the second half of 2008 and a few others.

(double click on the image to enlarge)
Pattern 1 (orange): This is the key pattern here, The Bump-and-Run-Reversal pattern, BARR (formerly and aptly known as the Bump-and-Run-Formation - BARF) started forming with a speculation phase in the mid 2006 when the market psychology was euphoric and gave a new meaning to irrational exuberance. This pattern was at disbelief at the key breaking levels, but finally succumbed to it. The psychology behind it is valid. Pattern 2 below is also part of the BARR pattern indicating the end of the speculation phase.
Pattern 2 (orange/white/blue): The double top (white) or a Head and Shoulders (blue) topping patterns depending on where you draw the line. Both are bearish topping patterns and both break at around the same level and measure to the same target.
Pattern 3 (blue): The typical Head and Shoulders pattern at an angle.
Pattern 4 (yellow): unveiling as we speak, the reverse head and shoulders topping pattern on the weekly time frame. Will it clear the key gap resistance and move to reach its target of ~1200? bounce down from the ~1080 resistance, Or will it stall and create another pattern that will reveal itself with time? (All of the above are possible on different time frames) Plan for all scenarios, and remember that being out of the market at times is also a plan to follow.
You can read more about the actual psychology that forms these patterns in any good technical analysis book. And you can be sure you will see this chart in the next book about The Crash of 2008, in the technical analysis section, maybe my own.
Of course hindsight is 20/20 and it’s easy to talk about these patterns of the past when they have already been drawn, but hindsight is what gives us the confidence in these patterns, especially in the longer time frames, enough confidence for that above than 50% probability we all seek in our trading. So when I see a pattern emerging I create my thesis around it, and trade it, while being cautious around the key levels where I typically look at other indicators to gauge the pulse of the market.
Swing and day traders are in the business of predicting the next move to make money, and technical analysis is the key tool for that.
@Stockaddict
Thursday, July 16, 2009
It's a Matter of Time..
Time is a key piece of the puzzle in technical analysis. A lot of the chart analysis you see on the stocktwits stream are for a specific time frame, usually that of the chartist, and not necessarily yours. So before you jump into that trade, check the time-frame of the chart and see if it agrees with yours.
Due to the time frame differences a lot of people will have conflicting views of the same financial instument, and be both correct. So always clarify your time frame before you make up your mind.
Finally, thanks to all those who chart and take charting requests, I know that the time and effort put into that is significant and the education by example provided to others is much appreciated.
Stockaddict
Monday, June 29, 2009
Mistakes even the best of us make: Not keeping the trading vehicle in mind..
I hope this was educational and helps clear up some of the common misunderstandings of trading ETFs. I usually tweet my stock research around midnight Pacific time, but you can always find my setups on stocktwits and sometimes charts posted on chart.ly when time allows.
Peace & profits to all,
@stockaddict


