I'm starting a series of postings that will act as a journal for our Real Estate investing journey.
Our government is deflating the dollar at a more accelerated rate now with an open ended license to "print". They are printing 40 Billion/Month with no end in sight. This is good for paying down our national debt as the lower value of the dollar pays down more debt effectively, but it immensely hurts the American people. The devaluation of the dollar brings rising commodity prices and cost of living overall.
We do not have to worry about inflation, our problem is the deflation of the dollar. Think about it, an ounce of gold back in the Roman days bought you a very nice Toga, a cool sash and head cover, and some good leather sandals. Now an ounce of gold does exactly the same, you take it to Saks Fifth Ave and you get a nice $1200 suit, a stylish $300 shirt and tie, and some awesome $300 Italian leather shoes. The value of gold hasn't changed, it just takes more dollars for that ounce of gold.
Throughout history, real estate has kept its value. The home your parents bought in the 50s and 60s for $40K is now worth $400K. The value of real estate is inversely related to the value of the dollar and the dollar has been deflating since it came off the gold standard. As the deflation of the dollar continues, real estate prices will rise in this post bubble era. And if the government is printing dollars to devalue its debt, we can do the same by getting a mortgage that will be easier to pay down in the future.
We have been investing in Real Estate for many years and realize its potential for the future from a cash flow point of view and from building generational wealth in general. Everything is on sale now, so it is time to buy. Once you realize the truths above, you will know you have to act now to ensure a good future for yourself and your family.
The million that you thought is needed to retire with your basic needs met, will not be enough and you will need more like two or three millions in a few decades. If you are calculating your retirement number based on today's income and dollars, you will need to reconsider as today's dollar will buy you 50c worth of goods by the time you retire.
As I've said in previous posts, keep an open mind, and look for alternatives. We are programmed to work, save, retire. This will not do. Open your eyes and smell the print presses.
Peace and profits to all.
@stockaddict
Wednesday, October 10, 2012


Tuesday, January 24, 2012
Chatting with WallstMaven.com
I met Mike Illenberger over a year and a half ago over twitter and immediately admired his passion for helping other traders by providing trading education from experienced traders and by example. Now he has partnered up with Jason Matias, a like-minded entrepreneur and trader, to create a community for all traders to help each other learn and make money. They've recently launched their joint venture websites and asked me to "hang out" with them at wallstmaven.com/blog and answer a few questions that many traders ask.
I couldn't pass it up, so in a relaxed, friendly atmosphere we had a chat about trading psychology, which happens to be my favorite topic about trading, we had a good time chatting about the subject. Check it out for yourself here, and give kudos to those guys for their dedication to trader education and awareness.
Peace and Profits to all.
@stockaddict
I couldn't pass it up, so in a relaxed, friendly atmosphere we had a chat about trading psychology, which happens to be my favorite topic about trading, we had a good time chatting about the subject. Check it out for yourself here, and give kudos to those guys for their dedication to trader education and awareness.
Peace and Profits to all.
@stockaddict
Wednesday, January 11, 2012
Why is Shorting Risky?
I’ve been asked this question many times by mentees and by friends alike as soon as the topic of shorting stocks starts up. Why is shorting riskier than getting long? The answer is simple. If you are long a stock, you can only lose a maximum of 100% of your investment when a stock reaches $0, therefore capping your loss to the amount you allocated for that trade. However if you are short you can lose more than you allocated and the actual loss is unlimited since the stock can move up with no upper limit.
A chart is worth a thousand words, take a look at INHX on Jan 9, 2012. INHX gapped up 140% the morning of Jan 9, 2012. So if you were short that stock, you’ve lost all your allocated amount + 40% more of that amount from your overall account that you did not designate for this trade. On the other hand if INHX gapped down while you were long your loss would still be limited by the 0 lower limit of a stock price. I’ve never seen a stock gap down to 0 in my trading career, but have seen many stocks gap up more than 100%.

So that’s why shorting can be risky and has unlimited loss potential, which you don’t have when you’re long.
I also have to add that these kinds of over 100% jumps happen mostly with thinly traded/low float stocks, you will likely not see this happening with higher quality stocks in general. Shorting can be as safe as getting long in the heavy weight stocks, as long as you disciplined to get out when the exit lights come on.
Another question I'm asked often is do I personally short the market. Of course. It's a must have skill in every profitable trader's repertoire. However I don't always have short positions in my accounts, since I'm generally a swing trader, the trading environment has to support shorting in general, and of course each stock is different and some stocks are just asking for it. In general if the market is bearish my short/long ratio is much higher than if the market is bullish. The market dictates that for swings. This is a personal preference as I know traders who make a good living using mostly short strategies in any market conditions. The down moves are swift and large in magnitude when panic sets in, so it can be very lucrative when done right.
If you have any question on this or any other trading topic, send it to me and I'll answer it when possible.
I also have to add that these kinds of over 100% jumps happen mostly with thinly traded/low float stocks, you will likely not see this happening with higher quality stocks in general. Shorting can be as safe as getting long in the heavy weight stocks, as long as you disciplined to get out when the exit lights come on.
Another question I'm asked often is do I personally short the market. Of course. It's a must have skill in every profitable trader's repertoire. However I don't always have short positions in my accounts, since I'm generally a swing trader, the trading environment has to support shorting in general, and of course each stock is different and some stocks are just asking for it. In general if the market is bearish my short/long ratio is much higher than if the market is bullish. The market dictates that for swings. This is a personal preference as I know traders who make a good living using mostly short strategies in any market conditions. The down moves are swift and large in magnitude when panic sets in, so it can be very lucrative when done right.
If you have any question on this or any other trading topic, send it to me and I'll answer it when possible.
Peace and Profits to all
@stockaddict
Monday, September 26, 2011
Becoming Your Own Banker
Nelson Nash's concept of privatized banking discussed in his book Becoming Your Own Banker is intriguing and worth your time to understand. This concept works on many levels; building financial security for the future, retirement planning and income, life insurance, and the possibility of creating family generational wealth with your children carrying on with this plan for generations to come. One of the major advantages of this concept is the ability to borrow your own money back out to use for anything you normally use a loan for, such as buying a house or a car while your policy still makes you money. Then you pay yourself the interest that you'd normally pay a bank while you recapitalize your "bank account". Sounds interesting doesn't it. I've talked with a life insurance agents/friends of mine and they were not aware of the side benefit of this specific life insurance policy and were only aware of the death benefit part of it, which is really a perk to know that your loved ones will be taken care of as well.
So educate yourself if you're interested in learning more about this. Here's a link to a pdf file that helps you start to understand some of the concepts used as well as some history of the financial system in the US.
get familiar with Nelson Nash's book, the Infinite Banking Concept (IBC), The idea of privatized banking that will free you from using these sick and greedy banks. Knowledge is power. Open your mind and find what works best for your financial needs and goals in life. Who else cares about your financial future?
Peace and profits to all.
@stockaddict
So educate yourself if you're interested in learning more about this. Here's a link to a pdf file that helps you start to understand some of the concepts used as well as some history of the financial system in the US.
get familiar with Nelson Nash's book, the Infinite Banking Concept (IBC), The idea of privatized banking that will free you from using these sick and greedy banks. Knowledge is power. Open your mind and find what works best for your financial needs and goals in life. Who else cares about your financial future?
Peace and profits to all.
@stockaddict
Thursday, March 17, 2011
Book Review: One Good Trade, by Mike Bellafiore
One Good Trade, is one good book about prop trading. You are sitting with an old friend and listening to his stories when reading this book. It was certainly hard to put down for me as it read more like a collection of stories on trading wisdom than your typical technical trading book.
Bella invites you to his trading firm and introduces you to his trading family as soon as you enter the book. He shares his family's endearing qualities that make you feel welcome right away, and connected to Dr Momentum, Franchise, Gman, and Spencer family members to name a few.
The book covers many topics that pertain to Proprietary Trading and how to get into this competitive arena, so if this is an endeavor of yours, this book is a must read. However, it also talks about the "trade" itself. You will learn a lot about trading psychology and basic trading setups from the many anecdotes that Bella shares throughout the book each with its sports analogy to drive the point home.
If you are a beginning trader or an advanced one, you will be able to read about yourself and learn how to deal with trading issues you may have/had or those that may pop up every once in a while, and you will learn how to deal with these issues. The best teacher doesn't teach, the best teacher shares his knowledge with others! Thank you for sharing Bella and for the Many One Good Trades to come!
Peace and profits to all,
@stockaddict
Bella invites you to his trading firm and introduces you to his trading family as soon as you enter the book. He shares his family's endearing qualities that make you feel welcome right away, and connected to Dr Momentum, Franchise, Gman, and Spencer family members to name a few.
The book covers many topics that pertain to Proprietary Trading and how to get into this competitive arena, so if this is an endeavor of yours, this book is a must read. However, it also talks about the "trade" itself. You will learn a lot about trading psychology and basic trading setups from the many anecdotes that Bella shares throughout the book each with its sports analogy to drive the point home.
If you are a beginning trader or an advanced one, you will be able to read about yourself and learn how to deal with trading issues you may have/had or those that may pop up every once in a while, and you will learn how to deal with these issues. The best teacher doesn't teach, the best teacher shares his knowledge with others! Thank you for sharing Bella and for the Many One Good Trades to come!
Peace and profits to all,
@stockaddict
Tuesday, November 30, 2010
The CAN SLIM System for Finding Growth Stocks
William J. O’Neil is the Founder of Investor’s Business Daily and the creator of the C.A.N.S.L.I.M. system for selecting growth stocks that move 100s – 1000s % in a Bull Market. He has studied the characteristics of stocks that were big winners since 1953 and came up with his now very popular CAN SLIM system. These growth stocks have two key components in their selection; fundamental indicated in the CAN SLIM approach outlined below, and Technicals in the cup-and-handle as well as the 7 week base then breakout approach to time entry into these stocks. There are other key factors on the technical front that identifies entry and exit points into such stocks and warning signs to look for according to his method. The TA aspects of O’Neil’s method are simple and will likely be the topic of a future blog.
Below are the highlights of the CAN SLIM system taken from O’Neils book The Successful Investor.
C = Current quarterly earnings per share: the higher, the better.
Primary factors :
· Should show a major percentage increase (18%-20% minimum) in the current quarterly EPS when compared to the prior year’s same quarter.
· Omit a company’s one-time extraordinary gains.
· Look for accelerating quarterly earnings growth.
Secondary factors:
· Look for quarterly sales growth of 25% or at least an acceleration in rate of sales percentage improvements over the last three quarters.
· Find at least one other stock in the same group showing string quarterly earnings growth.
A = Annual earnings increases: look for significant growth
Primary factors:
· The annual compounded growth rate for EPS should be at least 25%
· Significant growth in EPS for each of the last three years.
Secondary factors:
· The consensus earnings estimate for the next year should be higher than the current year.
· Return on equity of 17% or more.
· Look for annual cash flow per share greater than actual earnings per share by at least 20%
· Earnings should be stable and consistent from year to year over the last three years.
N = New products, new management, new highs: buying at the right time.
Primary factors:
· Look for companies with a major new product or service, new management, or a positive change for the industry.
Secondary factors:
· Look for stocks close to or making new highs in price after a period of consolidation.
· Strong volume on price move up.
S = Supply and demand: shares outstanding plus big volume demand.
Primary factors:
· Any size stock can be purchased under the CAN SLIM system.
· The market will shift its emphasis between small- and large-cap stocks over time.
· When choosing between two stocks, the stock with the lower number of shares should perform better to the upside, but can come down just as fast.
Secondary factors:
· Stocks with a large percentage of ownership buy top management are generally good prospects.
· Look for companies buying their own stock in the open market.
· Look for companies with a lower debt-to-equity ratio and companies reducing their debt-to-equity ratio and companies reducing their debt-to-equity ratios over the last few years.
L = Leader or laggard: which is your stock?
Primary factors:
· Buy among the top two or three stocks in a strong industry group.
· Use relative price strength to separate the leaders from the laggards –a stock with a relative strength rand below 70% is lagging and should be avoided.
Secondary factors:
· Look for companies with a relative strength rank of 80% or higher that are in a chart base pattern.
· Don’t buy stocks with weaker than average performance during a market correction.
I = Institutional sponsorship: follow the leaders.
Primary factors:
· Look for a stock to have several institutional owners. 10 might be a reasonable minimum.
· Look at quality of owners—seek out stocks held by at least one or two savvy portfolio managers.
· Look for stocks with an increasing, not decreasing number of sponsors.
Secondary factors:
· Avoid stocks that are over-owned—excessive institutional ownership.
M = Market direction
Primary factors:
· It is difficult to fight the trend, so try to determine if you are in a bull or bear market.
· Follow and understand what the general market averages are doing every day.
· Try to go 25% into cash when the market peaks and begins a major reversal.
· Heavy volume without significant price progress may signal a top, but initial market decline may be on lower volume.
· Follow market leaders for clues on strength of market.
Secondary factors:
· Look for divergences of key averages and indexes at major turns—divergence points to weaker and narrow market movement.
· Sentiment indicators may help highlight extreme psychological reversal points.
· The change in the discount rate is a valuable indicator to watch as a confirmation of market moves.
Peace and Profits to all
@stockaddict
Below are the highlights of the CAN SLIM system taken from O’Neils book The Successful Investor.
C = Current quarterly earnings per share: the higher, the better.
Primary factors :
· Should show a major percentage increase (18%-20% minimum) in the current quarterly EPS when compared to the prior year’s same quarter.
· Omit a company’s one-time extraordinary gains.
· Look for accelerating quarterly earnings growth.
Secondary factors:
· Look for quarterly sales growth of 25% or at least an acceleration in rate of sales percentage improvements over the last three quarters.
· Find at least one other stock in the same group showing string quarterly earnings growth.
A = Annual earnings increases: look for significant growth
Primary factors:
· The annual compounded growth rate for EPS should be at least 25%
· Significant growth in EPS for each of the last three years.
Secondary factors:
· The consensus earnings estimate for the next year should be higher than the current year.
· Return on equity of 17% or more.
· Look for annual cash flow per share greater than actual earnings per share by at least 20%
· Earnings should be stable and consistent from year to year over the last three years.
N = New products, new management, new highs: buying at the right time.
Primary factors:
· Look for companies with a major new product or service, new management, or a positive change for the industry.
Secondary factors:
· Look for stocks close to or making new highs in price after a period of consolidation.
· Strong volume on price move up.
S = Supply and demand: shares outstanding plus big volume demand.
Primary factors:
· Any size stock can be purchased under the CAN SLIM system.
· The market will shift its emphasis between small- and large-cap stocks over time.
· When choosing between two stocks, the stock with the lower number of shares should perform better to the upside, but can come down just as fast.
Secondary factors:
· Stocks with a large percentage of ownership buy top management are generally good prospects.
· Look for companies buying their own stock in the open market.
· Look for companies with a lower debt-to-equity ratio and companies reducing their debt-to-equity ratio and companies reducing their debt-to-equity ratios over the last few years.
L = Leader or laggard: which is your stock?
Primary factors:
· Buy among the top two or three stocks in a strong industry group.
· Use relative price strength to separate the leaders from the laggards –a stock with a relative strength rand below 70% is lagging and should be avoided.
Secondary factors:
· Look for companies with a relative strength rank of 80% or higher that are in a chart base pattern.
· Don’t buy stocks with weaker than average performance during a market correction.
I = Institutional sponsorship: follow the leaders.
Primary factors:
· Look for a stock to have several institutional owners. 10 might be a reasonable minimum.
· Look at quality of owners—seek out stocks held by at least one or two savvy portfolio managers.
· Look for stocks with an increasing, not decreasing number of sponsors.
Secondary factors:
· Avoid stocks that are over-owned—excessive institutional ownership.
M = Market direction
Primary factors:
· It is difficult to fight the trend, so try to determine if you are in a bull or bear market.
· Follow and understand what the general market averages are doing every day.
· Try to go 25% into cash when the market peaks and begins a major reversal.
· Heavy volume without significant price progress may signal a top, but initial market decline may be on lower volume.
· Follow market leaders for clues on strength of market.
Secondary factors:
· Look for divergences of key averages and indexes at major turns—divergence points to weaker and narrow market movement.
· Sentiment indicators may help highlight extreme psychological reversal points.
· The change in the discount rate is a valuable indicator to watch as a confirmation of market moves.
Peace and Profits to all
@stockaddict
Friday, November 12, 2010
Stop Loss Selection
How many times were you taken out of a trade just before the stock turns around and takes off in your presumed direction with you as the spring board? Not pleasant. So when a friend of mine asked me to help with placing stops I wanted to be clear on the topic since stops are a key risk management skill that traders must have to survive this game. This article talks specifically about stop losses, not for break even or stop with profits type exits.
The short answer is the same to many trading questions: it depends. It depends on the style of trading, time frame, risk tolerance, etc. That’s why system trading is very popular as the trading parameters; entries, exists, stop losses, stops, targets etc, are mostly pre-defined.
So let’s pick a specific scenario/system and take it from there: Swing trading days/weeks hold-time with buying support on signs of strength on the intra-day/daily/weekly/monthly charts review, using close prices.
You are at a point where you have identified your support levels and have your entry area with a good risk/reward ratio selected. For picking a stop, you have to get familiar with the stock's personality first to see how it behaves around key levels: Look at the history of the stock, does it trade cleanly around key levels or does it violate it before it recovers? This will help you decide your initial risk, whether to give your stop more room, use a soft or hard stop, or use that stock at all for that matter. The cleaner the levels the better.
You are at a point where you have identified your support levels and have your entry area with a good risk/reward ratio selected. For picking a stop, you have to get familiar with the stock's personality first to see how it behaves around key levels: Look at the history of the stock, does it trade cleanly around key levels or does it violate it before it recovers? This will help you decide your initial risk, whether to give your stop more room, use a soft or hard stop, or use that stock at all for that matter. The cleaner the levels the better.
Keep in mind that key levels can also change from day to day when they are an active moving average. Or when that moving average enters into the trading range of a stock that previously had clearly defined/drawn lines representing key levels, such as channels, breakout levels, etc.
Now that you have your support levels and are more familiar with the stock behavior, you can have a stop that’s lower than the support levels by roughly 0.5-1.5% depending on the price of the stock and how volatile it is. On shorter term momentum holds, you can enter as close to the low of the day (LOD) as possible with a stop under the LOD. Breaking the LOD+ and holding there is your signal that there’s more selling to come and the stock is not ready yet to bounce. In this case either step aside and let the sellers finish their business or if there’s a good short setups play then take the short side of the trade with as many checks in your favor as possible. Everything that applies for the long side the reverse applies on the short side, just make sure you are going with the trend in the time frame you are trading (many different topics here beyond the scope of this article.)
In addition, keep in mind that you do not have to stop out your entire position at a single level. You can get out of your position in stages depending on your risk and the strength of the supports. It does not have to be an all or none type trading depending on your style.
If you have any questions let me know.
Peace and profits to all,
@stockaddict
Friday, October 22, 2010
It is the Season for Extended Earnings.
Day traders should welcome earnings season with open arms as it is the season for earning big profits. When the news of earnings comes out, sometimes the preset expectations are not met or have been exceeded, which leads to volatile moves that day traders embrace. This is purely emotional and technical trading as the real earnings information has not been digested yet to decide the fate of the stock.
Most earnings come out before or after market hours to avoid full blown chaos that can take place on news
events. That's why stocks get halted most of the time when news is pending during normal market hours.
Trading the extended hours can be scary to most traders, however if you keep certain key rules in mind
you should be able to make the most from these reports while trading them during the extended hours.
And don't forget to keep those stocks on your day trading radar for the next day as well. The big moves will
usually carry over from the extended hours to regular hours. Be smart and have fun!
Peace and profits to all.
@stockaddict
Most earnings come out before or after market hours to avoid full blown chaos that can take place on news
events. That's why stocks get halted most of the time when news is pending during normal market hours.
Trading the extended hours can be scary to most traders, however if you keep certain key rules in mind
you should be able to make the most from these reports while trading them during the extended hours.
- Liquidity. The stock must be a main stream stock that the majority of traders know; AMZN, BIDU, AAPL, etc This provides the needed liquidity in the extended market as volumes of traders will be trading the same stock.
- Manage risk by managing your trade size. It is key to stay nimble during extended market hours as the spreads are typically large. You cannot be caught with thousands of shares that no one wants to buy at an acceptable price.
- Length of trade, the addict munch approach. As long as there's liquidity I'm going in and out of the stock at key technical levels or when the stock feels heavy when long.
- and most important is to be patient after the news comes out. As a technical trader you must wait for key levels and/or patterns to form before you trade the news in the extended market. You will find some serious and seriously ridiculous moves at first, but give it a few minutes and the direction will reveal itself. Similar to regular hour trading, you need to be even more disciplined to trade the extended market hours.
And don't forget to keep those stocks on your day trading radar for the next day as well. The big moves will
usually carry over from the extended hours to regular hours. Be smart and have fun!
Peace and profits to all.
@stockaddict
Wednesday, August 04, 2010
What is Thy Bidding My Master
How to bid in auctions:
The formulas explained here, in their simplest form, can be applied to any purchase you make with the intent to resell for profit and many other applications, from gold bullion to a piece of real estate at an auction. Given the fact that those real estate auctions are everywhere now you should know this before you bid on one. There is no big mystery to the math, but the real work is done during the due diligence period before the auctions, which is when experience comes into play.
1) Determine your profit margin. Say you want to make 25% P (P= Profit) on a property worth $180K FMV (FMV = Fair Market Value). Your highest bid (HB) then is calculated as follows:
HB = FMV * (1-P)
HB = 180,000 * 0.75
= 135,000
2) Typically those auctions, live or online, have a buyer's premium (BP) watch out and read the ffine print. So you have to add that to your calculation. In this case your New Highest Bid (NHB) is recalculated as follows:
Assume your BP is 5% (0.05)
NHB = HB / (1+BP)
NHB = 135,000/(1.05)
= 128,572
So 128,572 NHB or thereabouts is your maximum bid to achieve the profit margin you seek. Simple as that.
Keep these formulas in mind when you are buying anything with the intent to resell. Do your homework before you participate in these auctions whether in person or online, and don't get carried away in a bidding war. I know this is not stock related, but it’s similar to figuring out your buy limit order and not chasing a stock. It’s all in the ball park.
Peace and profits to all,
@stockaddict
The formulas explained here, in their simplest form, can be applied to any purchase you make with the intent to resell for profit and many other applications, from gold bullion to a piece of real estate at an auction. Given the fact that those real estate auctions are everywhere now you should know this before you bid on one. There is no big mystery to the math, but the real work is done during the due diligence period before the auctions, which is when experience comes into play.
1) Determine your profit margin. Say you want to make 25% P (P= Profit) on a property worth $180K FMV (FMV = Fair Market Value). Your highest bid (HB) then is calculated as follows:
HB = FMV * (1-P)
HB = 180,000 * 0.75
= 135,000
2) Typically those auctions, live or online, have a buyer's premium (BP) watch out and read the ffine print. So you have to add that to your calculation. In this case your New Highest Bid (NHB) is recalculated as follows:
Assume your BP is 5% (0.05)
NHB = HB / (1+BP)
NHB = 135,000/(1.05)
= 128,572
So 128,572 NHB or thereabouts is your maximum bid to achieve the profit margin you seek. Simple as that.
Keep these formulas in mind when you are buying anything with the intent to resell. Do your homework before you participate in these auctions whether in person or online, and don't get carried away in a bidding war. I know this is not stock related, but it’s similar to figuring out your buy limit order and not chasing a stock. It’s all in the ball park.
Peace and profits to all,
@stockaddict
Tuesday, July 27, 2010
Support and Resistance Zones. A New Concept in Technical Analysis.
Swing trading is my favorite trading style; the planning ahead and the follow through. Win or lose you know you did a good job following your plan. When you win you are confident in knowing that you can do it again with a similar plan. When you lose with a disciplined stop your solace is in knowing that you followed your plan, then you learn from your loss and move on.
One of my most common swing trading styles is buying support on signs of strength. I apply the concept of Support and Resistance Zones to stocks that do not have a clear support or resistance line to contain 100% of the move. You will find in most cases that a double line can be drawn to contain an area that encompasses the unruly moves and creates a narrow range instead of a simple line. These zones contain candles, or wicks and tails of candles of such unruly stock, especially when charting on different time frames.
Typically the inside line of the zone contains the majority of the stock move and has the most tags, while the outer line contains the straggling candle(s) action.
The TA support/buy zone is a tight price range where it is acceptable for me, from a Risk/Reward point of view, to buy/accumulate a stock when near or in that zone. Similar to line support, when zone support is violated on a close it indicates that the current pattern is no longer valid and we need to step aside until the
new pattern emerges. If a stock breaks out above the top of the resistance zone then the stock has broken out depending on volume and other factors, and vice versa for a breakdown from the support zone.
An example of this idea as well as trading a range bound stock can be seen in the chart of DAKT which can look too messy to swing trade. Take a look yourself before you see the marked up chart below and see if you can identify these zones or you decide it's just too messy for you to trade. Such a chart is a swing traders dream, at least this swing trader.

You buy/scale in anywhere under ~7.5 while in the support zone and sell/scale out while in the 9-9.5 resistance zone. rinse and repeat. just set your buys, stops and sells and forget-aboud-it.
Here are some posted examples of my charts with the zones that are usually drawn with single lines by chartists.
SPX
CRUS
XRT
SA
GS
BBEP
WFT
If you find such patterns, keep them on your pattern trade list. You can set alerts or you can leave a limit buy order in place while you go on with your busy days.
Hope that helps. I enjoy teaching the "trade", so go ahead and ask questions.
Peace and profits to all.
@stockaddict
One of my most common swing trading styles is buying support on signs of strength. I apply the concept of Support and Resistance Zones to stocks that do not have a clear support or resistance line to contain 100% of the move. You will find in most cases that a double line can be drawn to contain an area that encompasses the unruly moves and creates a narrow range instead of a simple line. These zones contain candles, or wicks and tails of candles of such unruly stock, especially when charting on different time frames.
Typically the inside line of the zone contains the majority of the stock move and has the most tags, while the outer line contains the straggling candle(s) action.
The TA support/buy zone is a tight price range where it is acceptable for me, from a Risk/Reward point of view, to buy/accumulate a stock when near or in that zone. Similar to line support, when zone support is violated on a close it indicates that the current pattern is no longer valid and we need to step aside until the
new pattern emerges. If a stock breaks out above the top of the resistance zone then the stock has broken out depending on volume and other factors, and vice versa for a breakdown from the support zone.
An example of this idea as well as trading a range bound stock can be seen in the chart of DAKT which can look too messy to swing trade. Take a look yourself before you see the marked up chart below and see if you can identify these zones or you decide it's just too messy for you to trade. Such a chart is a swing traders dream, at least this swing trader.

You buy/scale in anywhere under ~7.5 while in the support zone and sell/scale out while in the 9-9.5 resistance zone. rinse and repeat. just set your buys, stops and sells and forget-aboud-it.
Here are some posted examples of my charts with the zones that are usually drawn with single lines by chartists.
SPX
CRUS
XRT
SA
GS
BBEP
WFT
If you find such patterns, keep them on your pattern trade list. You can set alerts or you can leave a limit buy order in place while you go on with your busy days.
Hope that helps. I enjoy teaching the "trade", so go ahead and ask questions.
Peace and profits to all.
@stockaddict
Tuesday, May 04, 2010
Sector Moves - The Wind At Your Back.
A Sector breakout is one of the many opportunities in the market that offer high probability setups. Sector moves weigh heavily on underlying stock moves and therefore looking at sectors and subsectors on a regular basis should be a regular part of traders’ homework. A well rounded trader knows that both top-down and bottom-up approach are necessary to find good probability setups in the markets for day, swing, trend, and longer-term hold time-frames. This is the wind at your back that raises the probability of success in your trading.
Many sectors have been showing strength since last week, one of which is the retail sector. The XRTs weekly candle closed very strong and above breakout levels. Furthermore the sector has been basing for the last five months carving a solid base to spring from in either direction (pure TA). This is a trigger to delve into the stocks comprising this sector to confirm the strength. Last week’s blog highlights some of the findings from broken down-trends to overall strength and the opportunity of violent moves that ensue.
Now the XRT has had four weeks in a row of buying pressure and is due for some consolidation in the names that had big moves, but keep this sector on your radar for weeks and months to come as long as the uptrend is intact.
This is just one way to find stocks that are worth trading with high probability and less risk. “May the wind be ever at your back” with these sector moves.
Peace and profits to all,
@stockaddict
Many sectors have been showing strength since last week, one of which is the retail sector. The XRTs weekly candle closed very strong and above breakout levels. Furthermore the sector has been basing for the last five months carving a solid base to spring from in either direction (pure TA). This is a trigger to delve into the stocks comprising this sector to confirm the strength. Last week’s blog highlights some of the findings from broken down-trends to overall strength and the opportunity of violent moves that ensue.
Now the XRT has had four weeks in a row of buying pressure and is due for some consolidation in the names that had big moves, but keep this sector on your radar for weeks and months to come as long as the uptrend is intact.
This is just one way to find stocks that are worth trading with high probability and less risk. “May the wind be ever at your back” with these sector moves.
Peace and profits to all,
@stockaddict
Intrinsic Movers
This market reminds me of the time the engine of our boat broke down on the way back from Murion islands. We had a great day filled with fun and frolicking, but now we are stuck in the middle of the ocean off Ningaloo reef in Western Australia, waiting for help to arrive. Similarly, 2009 was a fun filled year, you couldn’t pick a stock that didn’t move up. But now we are stuck possibly a range or a down channel waiting for the big orders to come in and move us in the “right” direction again. Have the opportunities dried up? Are there no trades out there to be had for swing and longer holds? Not really, the market always presents opportunities, you just need to go fishing while you wait to have a little sashimi.
In this type of environment, where there’s no clear wind direction to fill your sails, my style changes a bit. I go to my “intrinsic movers”. A favorite in any market really, but proves most useful, with a high probability of success, when many other stocks and indexes are bobbing in the waves. The pattern that best serves these movers is the long-term down channel (and to a lesser degree the long-term triangle) breakout. Not the little flags and pennants that everyone looks at after a big move already happened, those will likely fail in this environment, but the ones that took months in the making. Whether you’re talking about a penny stock or a hundred dollar stock or ETF this is one of your fishing tools regardless of the circumstances.
Once the down channel breaks its resistance and confirms by closing two days in a row outside of the channel you will see some big moves coming in any tape. This is due to the nature of the pattern; you have the short-term channel players who shorted at the top of the channel, and the longer-term trend riders who shorted at much higher levels. They will see the channel dissolving and will want to get out before anyone else does. Therefore you get a violent initial move that you can ride blissfully with either a trailing stop of a manual/mental stop to get you out before the move is done.
There are many examples I’ve posted over time. Take sugar ETF SSG for example. I posted the chart of the breakout back in December when the channel broke to the upside. A violent move from 65 to 85 in about a month ensued.
Another obvious one is the US Dollar UUP, after a long downtrend that started in March 2009, also broke the channel with such violence that you couldn’t miss the opportunity. Crowded or not, those labels don’t negate the opportunity these down-channel-breaks present. I posted this chart many times on chart.ly.
RMD, I posted the chart of this stock back in August with its long down trend, AZO December 9 CQP as well as many others . All had a strong down trend that caused the price to catapult after the channel break.
This does not mean that we will have an uptrend after the break of the down trend, just a change of the current pattern. If you are a fundy player who thinks the stock is undervalued, this is your signal to get in as well instead of “averaging down”. There are other details that entail, but this is the crux of this trading style.
Many of the retail stocks are going through this right now including M and JCP as well as a few others I’ve tweeted about recently. This is purely a technical play, more of a knee jerk reaction type of move really with a high probability of success.
Add this to your bag of tricks and have fun with it. There’s always an opportunity in the markets no matter what direction we’re moving, the more patterns and tools you have the better prepared you will be for any market.
Peace and profits to all,
@stockaddict
In this type of environment, where there’s no clear wind direction to fill your sails, my style changes a bit. I go to my “intrinsic movers”. A favorite in any market really, but proves most useful, with a high probability of success, when many other stocks and indexes are bobbing in the waves. The pattern that best serves these movers is the long-term down channel (and to a lesser degree the long-term triangle) breakout. Not the little flags and pennants that everyone looks at after a big move already happened, those will likely fail in this environment, but the ones that took months in the making. Whether you’re talking about a penny stock or a hundred dollar stock or ETF this is one of your fishing tools regardless of the circumstances.
Once the down channel breaks its resistance and confirms by closing two days in a row outside of the channel you will see some big moves coming in any tape. This is due to the nature of the pattern; you have the short-term channel players who shorted at the top of the channel, and the longer-term trend riders who shorted at much higher levels. They will see the channel dissolving and will want to get out before anyone else does. Therefore you get a violent initial move that you can ride blissfully with either a trailing stop of a manual/mental stop to get you out before the move is done.
There are many examples I’ve posted over time. Take sugar ETF SSG for example. I posted the chart of the breakout back in December when the channel broke to the upside. A violent move from 65 to 85 in about a month ensued.
Another obvious one is the US Dollar UUP, after a long downtrend that started in March 2009, also broke the channel with such violence that you couldn’t miss the opportunity. Crowded or not, those labels don’t negate the opportunity these down-channel-breaks present. I posted this chart many times on chart.ly.
RMD, I posted the chart of this stock back in August with its long down trend, AZO December 9 CQP as well as many others . All had a strong down trend that caused the price to catapult after the channel break.
This does not mean that we will have an uptrend after the break of the down trend, just a change of the current pattern. If you are a fundy player who thinks the stock is undervalued, this is your signal to get in as well instead of “averaging down”. There are other details that entail, but this is the crux of this trading style.
Many of the retail stocks are going through this right now including M and JCP as well as a few others I’ve tweeted about recently. This is purely a technical play, more of a knee jerk reaction type of move really with a high probability of success.
Add this to your bag of tricks and have fun with it. There’s always an opportunity in the markets no matter what direction we’re moving, the more patterns and tools you have the better prepared you will be for any market.
Peace and profits to all,
@stockaddict
Friday, August 21, 2009
Natural Gas Commodity Prices Drop to a 7-Year Low!
Natural gas closed yesterday (Aug 20,09) at 2.945 per million BTUs on NYME, the lowest closing level for a front-month contract since August 12 of 2002 according to the CME group. The next possible support target is 2.52 per million BTUs, which is the level of March 2002. August has historically been a bad month for Natural gas futures as this 17-year-study chart shows.
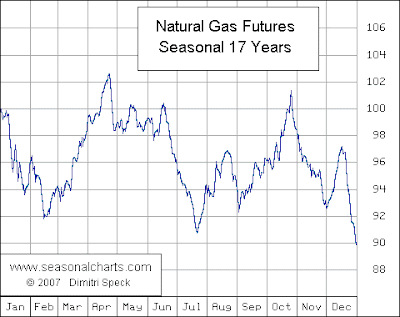
(Click on image to enlarge)
The price drop was exasperated by the rise in supply as the EIA reports a rise of 55 billion cubic feet to stand at 3204 Bcf, which is 562 Bcf higher than last year at this time and 513 above the 5-year average. Barring any storms, the glut of supply will continue to hurt prices. – data source MarketWatch
The economic recession is also tampering demand, but new clean energy politics is on the table. T. Boone Pickens has been lobbying congress to use natural gas as the clean-energy solution for vehicles to rid our dependence on oil. “He touted natural gas as the best alternative vehicular fuel because it’s a domestic resource that reduces our foreign oil consumption, and enhances America’s energy security; clean (NGV vehicles emit up to 95 percent less pollution than gasoline or diesel vehicles); less expensive than petroleum and hydrogen; and safe (lighter-than-air compressed natural gas is nontoxic and disperses quickly, and has a higher ignition temperature than gasoline and diesel fuel, which reduces the chances of accidental ignition).”
–www. Boonespickens.com
There isn't a pure trading vehicle for the Natural Gas Commodity, these ETFs are the closest thing available:
Natural Gas Industry: $FCG
Natural Gas Commodities futures: $UNG
Oil and Natural Gas exploration and production: $XOP
Oil and Natural Gas equipment and services: $PXJ
@stockaddict

(Click on image to enlarge)
The price drop was exasperated by the rise in supply as the EIA reports a rise of 55 billion cubic feet to stand at 3204 Bcf, which is 562 Bcf higher than last year at this time and 513 above the 5-year average. Barring any storms, the glut of supply will continue to hurt prices. – data source MarketWatch
The economic recession is also tampering demand, but new clean energy politics is on the table. T. Boone Pickens has been lobbying congress to use natural gas as the clean-energy solution for vehicles to rid our dependence on oil. “He touted natural gas as the best alternative vehicular fuel because it’s a domestic resource that reduces our foreign oil consumption, and enhances America’s energy security; clean (NGV vehicles emit up to 95 percent less pollution than gasoline or diesel vehicles); less expensive than petroleum and hydrogen; and safe (lighter-than-air compressed natural gas is nontoxic and disperses quickly, and has a higher ignition temperature than gasoline and diesel fuel, which reduces the chances of accidental ignition).”
–www. Boonespickens.com
There isn't a pure trading vehicle for the Natural Gas Commodity, these ETFs are the closest thing available:
Natural Gas Industry: $FCG
Natural Gas Commodities futures: $UNG
Oil and Natural Gas exploration and production: $XOP
Oil and Natural Gas equipment and services: $PXJ
@stockaddict
Sunday, August 16, 2009
The Power of Technical Analysis; A Case in Point Study of the S&P500 Chart.
Technical analysis is a graph of the psychology of the market and should be part of every trader and investor’s arsenal if they don’t want to become road kill on Wall Street. It is a guide to the future empowered by the past and based on human psychology.
Case in point is the SPY500 starting back in 2004 in mid-bubble times. Note that there are other Technical factors contributing to the success of the patterns, such as the 50MA crossing above the 200MA in mid 2004, then below it towards the second half of 2008 and a few others.

(double click on the image to enlarge)
Case in point is the SPY500 starting back in 2004 in mid-bubble times. Note that there are other Technical factors contributing to the success of the patterns, such as the 50MA crossing above the 200MA in mid 2004, then below it towards the second half of 2008 and a few others.

(double click on the image to enlarge)
Pattern 1 (orange): This is the key pattern here, The Bump-and-Run-Reversal pattern, BARR (formerly and aptly known as the Bump-and-Run-Formation - BARF) started forming with a speculation phase in the mid 2006 when the market psychology was euphoric and gave a new meaning to irrational exuberance. This pattern was at disbelief at the key breaking levels, but finally succumbed to it. The psychology behind it is valid. Pattern 2 below is also part of the BARR pattern indicating the end of the speculation phase.
Pattern 2 (orange/white/blue): The double top (white) or a Head and Shoulders (blue) topping patterns depending on where you draw the line. Both are bearish topping patterns and both break at around the same level and measure to the same target.
Pattern 3 (blue): The typical Head and Shoulders pattern at an angle.
Pattern 4 (yellow): unveiling as we speak, the reverse head and shoulders topping pattern on the weekly time frame. Will it clear the key gap resistance and move to reach its target of ~1200? bounce down from the ~1080 resistance, Or will it stall and create another pattern that will reveal itself with time? (All of the above are possible on different time frames) Plan for all scenarios, and remember that being out of the market at times is also a plan to follow.
You can read more about the actual psychology that forms these patterns in any good technical analysis book. And you can be sure you will see this chart in the next book about The Crash of 2008, in the technical analysis section, maybe my own.
Of course hindsight is 20/20 and it’s easy to talk about these patterns of the past when they have already been drawn, but hindsight is what gives us the confidence in these patterns, especially in the longer time frames, enough confidence for that above than 50% probability we all seek in our trading. So when I see a pattern emerging I create my thesis around it, and trade it, while being cautious around the key levels where I typically look at other indicators to gauge the pulse of the market.
Swing and day traders are in the business of predicting the next move to make money, and technical analysis is the key tool for that.
@Stockaddict
Subscribe to:
Posts (Atom)


